Blog/LLMOps & evals
Observability for LLM agents with OpenTelemetry: traces, tokens, PII and evals
How to trace LLM agents with OpenTelemetry: GenAI semantic conventions and their status, span tree, token metrics, sampling, PII, evals and tool options.
Balázs Csorba··12 min read
- OpenTelemetry
- LLM observability
- AI agents
- Tracing
- Evals
Key takeaways
- The OpenTelemetry GenAI semantic conventions now live in their own repository and are still at Development status, so pin versions and expect attribute renames.
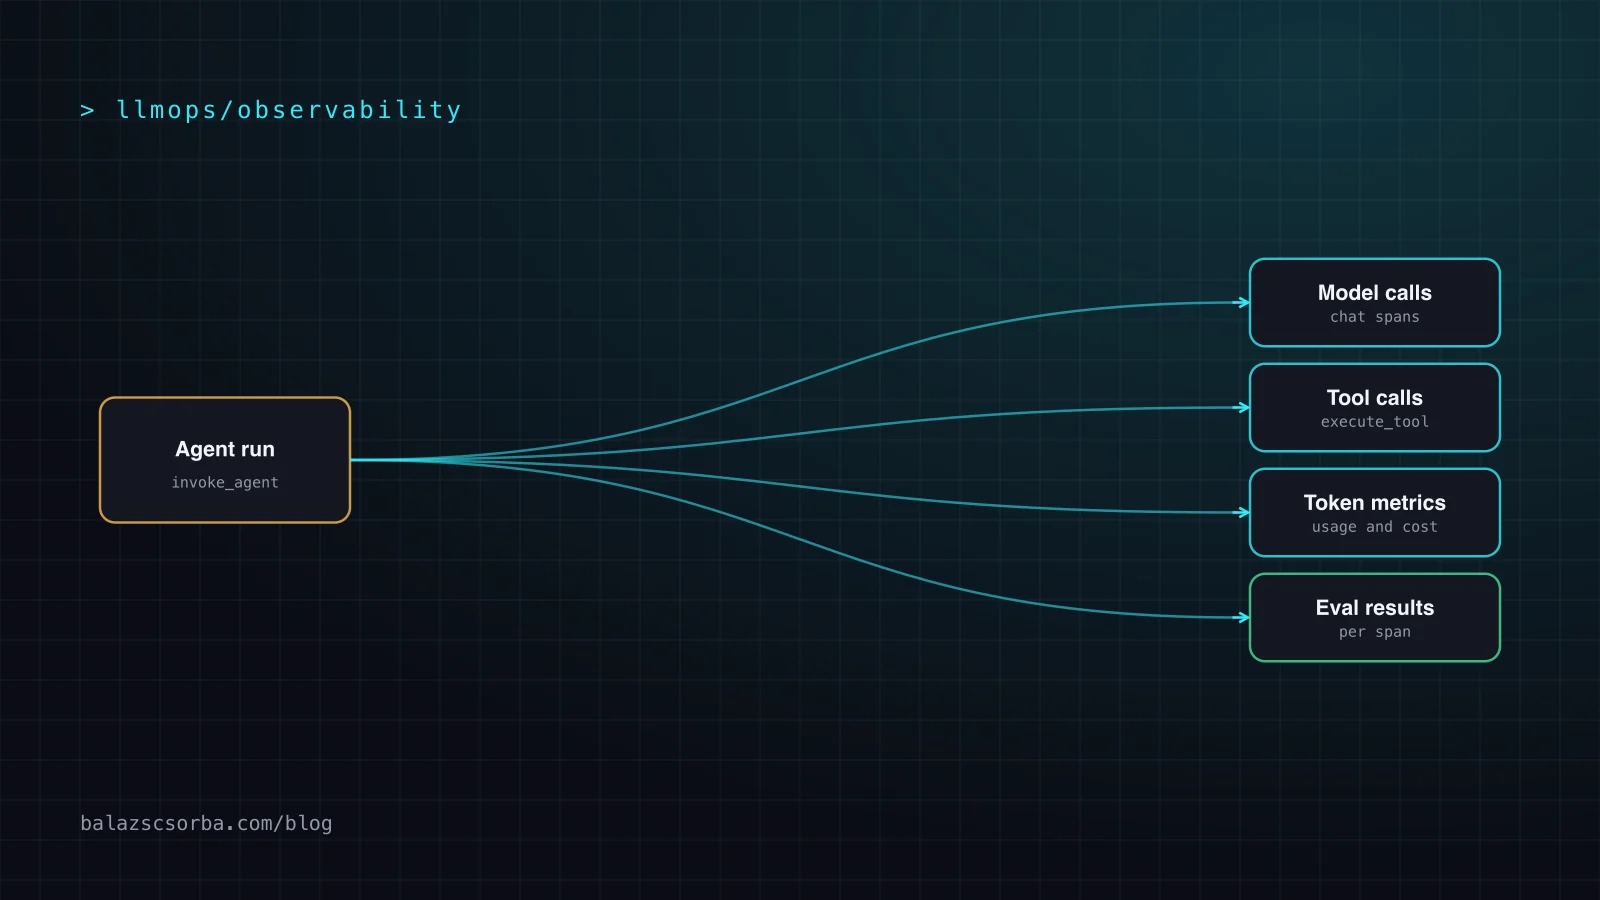
- Model one agent run as one trace: an invoke_agent root span, chat spans for every model call and execute_tool spans for every tool call. That tree is what makes loops and wasted steps visible.
- Record token counts, model, finish reason and error type on every span, but keep prompts, tool arguments and results off by default (they are opt-in in the conventions) and store them separately when you need them.
- Sample on outcomes, not on a coin flip: keep every error, slow or expensive run and every failed eval, and a small share of the rest. Remember that evals usually finish after the trace does.
- Any OTLP backend can take agent traces; the real differences are how well it understands the gen_ai attributes, where it is hosted and what it costs. Start with the standard and keep the exporter swappable.
A classic web request is one call, one answer and a stack trace if it breaks. An agent run is a small program the model writes as it goes: it plans, calls a tool, reads the result, calls the model again, retries, and sometimes loops until a budget runs out. When such a run costs four times what it should or quietly gives a wrong answer, logs show you scattered lines, not the shape of what happened.
Distributed tracing is already the right tool for "what happened, in which order, and how long did each part take". OpenTelemetry (OTel) is the vendor-neutral way to produce traces, and it now has a dedicated set of GenAI semantic conventions. They are young, they are still marked Development, and they have just moved house, so this article is as much about what to pin and what to wrap as about what to record.
I cover the conventions and their real status, the span tree for an agent run, what to record on each span, token and cost metrics, sampling, PII, the link to evals, and how the common backends fit. It ends with a checklist. I assume you know what an agent loop is.
Why agents need traces, not just logs
Three failure modes of agents are almost invisible without a trace. Loops and wasted steps: the model calls the same search tool five times with slightly different arguments. Silent degradation: a retrieval step returns nothing, the model answers from memory and the output looks plausible. Cost drift: a prompt change or a larger tool result inflates the context, and every later model call in the run gets more expensive.
All three are properties of a whole run, not of a single call. A trace gives you the run as a tree with timing, token counts and outcomes per node, and it lets you ask the questions that matter: how many model calls per request at p95, which tool fails most, which step dominates latency. If you only log, you will rebuild a worse tracing system out of correlation IDs.
The GenAI semantic conventions: what exists and how stable it is
Semantic conventions are the agreed names for attributes, spans and metrics, so that a backend can understand telemetry from any library. For GenAI they cover model spans (inference, embeddings, retrieval, memory), agent spans (create_agent, invoke_agent, invoke_workflow, plan), tool execution, metrics, events and an MCP convention. Provider-specific pages exist for Anthropic, OpenAI, AWS Bedrock and Azure AI Inference.
Two facts matter before you build on them. First, the conventions have moved: the page on opentelemetry.io now only redirects to the separate open-telemetry/semantic-conventions-genai repository. Second, they are not stable. The overview page is marked Development, and as of its July 2026 review the independent write-up I used found no GenAI-specific attribute, span, metric or event marked Stable (only shared attributes such as error.type are). Expect names to change between releases.
The practical consequence is a version switch. Instrumentations that supported the older conventions keep emitting the frozen v1.36-era output by default and need OTEL_SEMCONV_STABILITY_OPT_IN=gen_ai_latest_experimental to emit the newer shape. Not every framework honours that variable the same way, so check a real exported span instead of trusting the docs. Datadog, for example, requires the 1.37 or newer shape.
The trace tree: one run, one trace
The conventions define the span kinds you need. The root is an invoke_agent span (kind INTERNAL for an in-process agent, CLIENT for a remote agent service). Under it sit one chat span per model call (named after the operation and the requested model, kind CLIENT), one execute_tool span per tool call (INTERNAL) and, if your agent has an explicit planning phase, a plan span. A multi-step pipeline around agents can use an invoke_workflow span. Retrieval has its own span, named after the data source.
Two details are worth copying. The span name for a model call is the operation plus the model, for example chat plus the model name, which keeps cardinality low and makes the waterfall readable. And the conventions explicitly encourage you to instrument your own tools by hand with execute_tool spans, because an auto-instrumentation cannot know about tools that run in your code. For tools that call MCP servers, the MCP convention can carry the trace context in the request metadata (traceparent, tracestate and baggage), so the server side joins the same trace. See MCP tool design lessons for why that server-side view matters.
One more point on shape: a retried model call should be one span covering all retries, not several, because the convention defines the span as the logical operation as seen by the caller. If you want to see the retries, record them as events or attributes on that span.
What to record on each span
The standard tells you what is available; it does not tell you what is worth the storage. This is the set I would start with. Names in the second column are from the conventions unless marked as custom.
| Unit | Attributes to set | Why it pays off |
|---|---|---|
| Agent run (invoke_agent) | gen_ai.agent.name, gen_ai.agent.version, gen_ai.conversation.id, error.type, plus custom: release, tenant, final outcome | Group runs by agent version and session; compare releases; find the runs that ended in a handover or a failure |
| Model call (chat) | gen_ai.operation.name, gen_ai.provider.name, gen_ai.request.model, gen_ai.response.model, gen_ai.response.finish_reasons, gen_ai.usage.input_tokens, gen_ai.usage.output_tokens, cache read and reasoning token counts, error.type | Cost per call, truncation (finish reason length), cache hit rate, model fallbacks, which provider errors dominate |
| Request settings | gen_ai.request.temperature, gen_ai.request.max_tokens, gen_ai.request.reasoning.level, gen_ai.prompt.name, gen_ai.prompt.version | Explain behaviour changes; tie output quality to a prompt version |
| Tool call (execute_tool) | gen_ai.tool.name, gen_ai.tool.call.id, gen_ai.tool.type, error.type, plus custom: read or write, approval given | Failure rate and latency per tool; find write actions and who approved them |
| Retrieval | gen_ai.data_source.id, plus custom: top-k, number of hits, document IDs without content | Spot empty or poor retrieval before the model hides it behind a fluent answer |
| Content | gen_ai.system_instructions, gen_ai.input.messages, gen_ai.output.messages, gen_ai.tool.call.arguments, gen_ai.tool.call.result (all opt-in) | Debugging and building test cases, at a privacy and storage price (see the PII section) |
| Evaluation | gen_ai.evaluation.name, gen_ai.evaluation.score.value, gen_ai.evaluation.score.label, gen_ai.evaluation.explanation | Quality signal attached to the exact span it judges |
Set the attributes that a sampler may need at span creation time. The conventions list gen_ai.operation.name, gen_ai.provider.name, gen_ai.request.model and the server address (and gen_ai.agent.name for agent spans) as the ones that SHOULD be available at creation, because a head sampler cannot see attributes you add later.
Token and cost metrics
Spans give you per-run detail; metrics give you cheap, long-lived trends. The conventions define token usage counters per category (input, output, cache read, cache write, reasoning) broken down by modality, which they describe as the primary instruments for consumption and a proxy for cost. Next to them sit histograms for per-operation token distribution, meant for p95 and p99 outlier detection and explicitly not for totals or cost. For agents there are histograms for invocation duration, number of inference calls per invocation and number of tool calls per invocation, plus a tool execution duration. The last two are the ones I would put on a dashboard first: they show a loop before the invoice does.
Mind the arithmetic. The input token count SHOULD include cached tokens, and the cache read, cache write and reasoning counts are subsets of the input and output totals. If you add them up as separate line items you double count. The conventions also define no price or cost attribute, so cost is something you compute: multiply the token categories by a price table keyed by the response model, in your backend or in a pipeline stage, and version that table. The LLM cost, latency and prompt caching article goes into what to do once you can see the numbers.
Keep metric dimensions low-cardinality: model, provider, agent name, operation, outcome. A user ID or conversation ID belongs on a span, not on a metric, or your metrics bill will grow with your user base.
Sampling: keep the interesting runs
Agent traces are bigger than ordinary web traces, and with content capture they can be much bigger. You will sample. OpenTelemetry distinguishes head sampling (the decision is made when the trace starts, for example a fixed percentage by trace ID) from tail sampling (the decision is made after seeing all or most spans, so you can always keep traces with errors or high latency). The same documentation is frank about the cost: tail sampling is harder to implement and operate, and the component making the decision has to be stateful.
For agents I would use a simple policy, and I would treat the percentages as a starting point to tune:
- Keep 100% of runs with an error, a timeout, a handover to a human, or a user complaint.
- Keep 100% of runs far above your normal cost, duration or number of model calls. These are your loops.
- Keep 100% of runs that failed an eval, and of runs in a canary release.
- Sample a small share, say 5 to 10 percent, of everything else, so that you still have a representative baseline.
- Do not rely on sampled traces for rates. Compute rates and alerts from metrics (the duration, token and tool-call instruments above), not by counting sampled traces.
Two agent-specific traps. A run can last minutes, so the tail sampler must wait long enough before deciding, and it must hold every span of that run in memory meanwhile. And an eval score usually arrives after the trace has been finished and exported, so it cannot drive the tail decision unless you evaluate inline. If you want failed evals to survive sampling, either run a cheap inline check on every run or attach the score later and make sure the sampled-out trace is still available for the runs you flag.
PII and sensitive content in traces
Prompts, tool arguments and tool results contain whatever your users and your systems contain: names, emails, order numbers, contract text, sometimes secrets. The conventions take a clear position. Instructions, inputs and outputs are considered sensitive and often large, so instrumentations SHOULD NOT capture them by default and SHOULD offer an opt-in. They describe three patterns: record nothing (the default), record content on span attributes, or store content externally and put only references on the spans, which is the recommended pattern in production because external storage has its own access controls.
That maps to a practical setup:
- Production default: metadata only. Model, tokens, finish reason, tool names, error types, IDs. Surprisingly much debugging works with this.
- Pre-production and tests: full content on spans, because there is no real personal data and you want maximum visibility.
- Production content: only through the external-storage pattern, for a sampled or flagged subset, with a short retention period and access limited to the people who need it. The conventions let an in-process hook modify or redact content before it is recorded, and that hook runs regardless of the sampling decision.
- Redact before export, not in the backend. A processing stage in your telemetry pipeline or an in-process hook can remove patterns such as emails and card numbers; do not rely on the vendor to do it after the data has left your network.
- Use pseudonymous IDs for users and conversations, never raw emails or names, so you can find a run without a trace becoming a personal-data register.
Tool arguments deserve special attention, because they are often the most identifying part of a run and are easy to forget. If your traces leave the EU or reach a US vendor, the same rules apply as for the model API itself, see GDPR and LLM APIs. Prompt content in traces is also a prompt-injection data source: a trace viewer that renders untrusted model output is a target, which is another reason to keep access tight.
Linking traces to evals
Traces tell you what happened; evals tell you whether it was good. They are most useful when joined. The conventions define a gen_ai.evaluation.result event with the evaluation name, a score value, a human-readable label, an explanation and the response ID, and say it SHOULD be parented to the GenAI operation span being evaluated, or carry the response ID when no span is available. An LLM judge or a rule-based check that runs after the fact can therefore write its verdict straight onto the node it judged.
I use the join in three ways. Offline: run the eval dataset through the same instrumented agent, tag the traces with a run or release identifier (a custom attribute), and compare cost, step count and score per release in one place. Online: score a sample of production runs and alert on a falling pass rate, with the failing traces one click away. Feedback loop: when a production trace fails, copy its input (and expected behaviour) into the test set, which needs content captured, so use the external-storage pattern for the flagged runs. How to build the evals themselves is covered in LLM evals for product features.
Tool options
The nice property of OTLP is that the choice of backend comes last. What I checked in the vendors' own documentation:
| Tool | How it takes OpenTelemetry | Worth knowing |
|---|---|---|
| Langfuse | OTLP endpoint at /api/public/otel with basic auth; HTTP/JSON and HTTP/protobuf, no gRPC; maps gen_ai attributes, OpenInference and its own langfuse attributes | LLM-specific features on top (prompt linking, scoring, cost tracking); self-hostable; the repository is MIT-licensed except for ee directories under a separate licence |
| Arize Phoenix | Built on OpenTelemetry; uses the OpenInference conventions, which are complementary to OTel; local collector at /v1/traces | Open source and self-hosted, under the Elastic License 2.0; Arize AX is the managed sibling; strong for experiments and evals |
| Datadog LLM Observability | OTLP over HTTP/protobuf with a dd-api-key header; requires the OpenTelemetry 1.37 or newer gen_ai shape | Spans without any gen_ai attribute are dropped; the docs mention a delay of a few minutes before traces show up; best if you are already on Datadog |
| Honeycomb | OTLP over gRPC, HTTP/protobuf and HTTP/JSON, with an API-key header and an EU endpoint | A general trace backend: the ingest docs I read say nothing GenAI-specific, so you build the views yourself |
My recommendation: instrument with OpenTelemetry and your own thin helper layer, export through a pipeline stage you control, for example an OpenTelemetry Collector (a natural place for redaction, sampling and cost enrichment), and pick the backend by hosting model and by what your team already operates. If data residency matters, a self-hosted Langfuse or Phoenix is the easiest to defend. If you already pay for a general observability platform, check how well it renders gen_ai spans before adding another tool. I did not verify other vendors, such as the Grafana stack, and leave them out on purpose.
A checklist for the first sprint
This is the order I would work in:
- Pick the OTLP backend and put a pipeline stage you control in between. Do the redaction and sampling there.
- Install the instrumentation for your provider or framework, pin its version and check one real exported span against the conventions (including the OTEL_SEMCONV_STABILITY_OPT_IN variable).
- Add a root invoke_agent span per run and manual execute_tool spans for your own tools.
- Set model, provider, token usage, finish reason and error type on every model span; add agent version, release and a pseudonymous conversation ID.
- Turn off content capture in production; turn it on in pre-production; decide the external-storage route for flagged runs.
- Build three dashboards: model calls and tool calls per run (p50, p95), tokens and computed cost per agent version, error and timeout rate per tool.
- Add the sampling policy: all errors, outliers and failed evals, a small share of the rest.
- Write eval results as gen_ai.evaluation.result events on the judged spans, and feed failing traces back into the test set.
- Add a golden-file test that fails when instrumentation output changes shape.
If you are working in a harness, the same instrumentation also pays off there, see harness engineering for coding agents.
Where I would not over-invest yet
Do not build deep, custom analytics on the exact attribute names of a Development-status standard. Build on the concepts, a tree of spans with token counts, outcomes and scores, and keep the mapping from concept to attribute name in one place. The conventions will keep moving, and the backends will keep catching up; a team that traces every run and can answer "what did this run do and what did it cost" is ahead of one that waits for the standard to settle.
Sources
- OpenTelemetry: GenAI semantic conventions repository (open-telemetry/semantic-conventions-genai)
- GenAI conventions: overview (status Development)
- GenAI conventions: model spans, execute_tool and content capture
- GenAI conventions: agent spans
- GenAI conventions: metrics
- GenAI conventions: inference token metrics
- GenAI conventions: events (gen_ai.evaluation.result)
- GenAI conventions: Model Context Protocol
- OpenTelemetry docs: GenAI conventions moved notice
- OpenTelemetry docs: Sampling
- John Hodge: The state of the OpenTelemetry GenAI semantic conventions (July 2026)
- Langfuse docs: OpenTelemetry integration
- Langfuse repository and licence
- Arize Phoenix repository
- Arize OpenInference repository
- Datadog docs: OpenTelemetry instrumentation for LLM Observability
- Honeycomb docs: Send data with OpenTelemetry
Frequently asked questions
What are the OpenTelemetry GenAI semantic conventions?
They are the standard attribute, span, metric and event names for generative AI workloads: gen_ai.operation.name, gen_ai.request.model, gen_ai.usage.input_tokens, execute_tool spans, invoke_agent spans and more. As of October 2026 they are maintained in the open-telemetry/semantic-conventions-genai repository and every GenAI-specific item is still marked Development, not Stable.
How do I trace an LLM agent with OpenTelemetry?
Create one trace per agent run. Wrap the run in an invoke_agent span, wrap each model call in a chat span and each tool call in an execute_tool span, and set the gen_ai attributes for model, token usage, finish reason and errors. Use an instrumentation library for your provider or framework, add manual spans for your own tools, and export through OTLP.
Should I log prompts and responses in traces?
Not by default. The conventions treat instructions, inputs and outputs as sensitive and large, tell instrumentations not to capture them unless you opt in, and suggest storing content externally and recording references on the span in production. Capture full content in pre-production, or for a sampled and access-controlled subset.
How do I track LLM token usage and cost with OpenTelemetry?
Record gen_ai.usage.input_tokens and gen_ai.usage.output_tokens on every inference span and use the token usage counters for dashboards. The conventions define token counts, not prices, so you compute cost in your backend or pipeline from a price table keyed by the response model. Cached and reasoning tokens are subsets of the input and output totals.
Which tool is best for LLM observability: Langfuse, Phoenix, Datadog or Honeycomb?
It depends on what you already run. Langfuse and Arize Phoenix are LLM-focused and can be self-hosted, Datadog LLM Observability fits teams already on Datadog and requires gen_ai attributes from OpenTelemetry 1.37 onwards, and Honeycomb is a general OTLP trace backend. Instrument with OpenTelemetry first and the backend stays a replaceable decision.
How do I connect traces to evals?
Attach evaluation results to the span they judge. The GenAI conventions define a gen_ai.evaluation.result event with a name, score, label and explanation that should be parented to the evaluated span. Run offline evals through the same instrumented code, and turn failing production traces into new test cases.